
The software industry used to discuss productivity on an annual basis. Claude Code and Codex have disrupted that rhythm: one month can change which tasks can be handed to a machine, and another can change what it costs to complete them. The important question is no longer simply whether these tools can write code. It is how software supply, people’s work and corporate budgets are being redistributed.
This article focuses on Claude Code and Codex. It does not review other coding assistants one by one. These two take center stage because we are interested in a way of working that reads repositories, edits code, runs tools and repeatedly verifies results. The September 2026 release of Claude Sonnet 5.5 and the October 2026 Codex updates illustrate why any discussion of capabilities needs a month attached.[1][2]
Verified through October 12, 2026. The figures below primarily use calendar months, clearly distinguishing complete months, observations within a month and rolling 28-day windows. Months without public values remain gaps. We do not divide annual or quarterly figures into monthly averages, or conflate code volume, app counts, working time and layoffs. The forward-looking section presents judgments, not statistics about events that have already occurred.
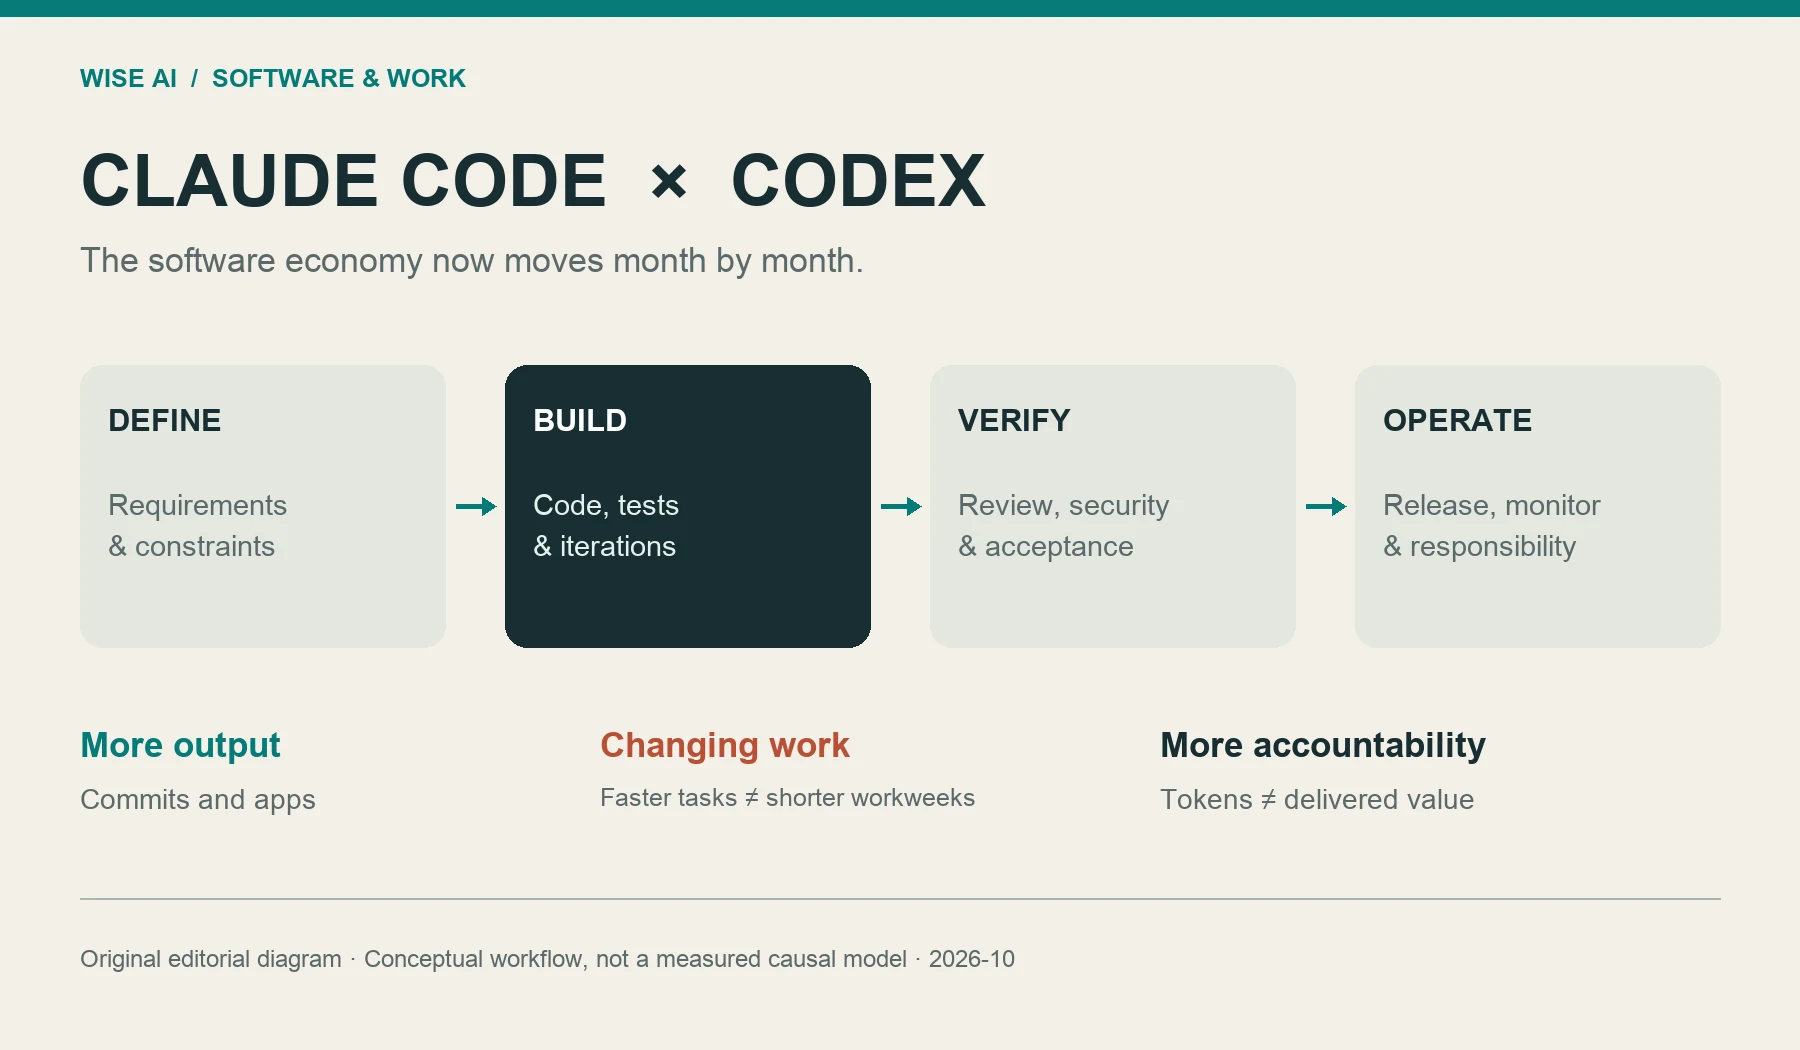
Figure: An original WISE AI workflow diagram. It illustrates changing responsibilities in software production, not measured causal contributions at each stage.
How much more output on GitHub? September saw 7.38 billion commits
An infrastructure article published by GitHub on October 6, 2026 provides the clearest indication of the change: in September 2026, the platform recorded 7.38 billion commits, more than five times the September 2025 figure. The article does not give the exact September 2025 baseline, so an exact growth rate cannot be calculated.[3]
| Observation month | Metric | Official figure | How to interpret it |
|---|---|---|---|
| 2025-09 | Git activity events | 218.2 billion/month | Infrastructure activity including reads and writes, not new code |
| 2026-08 | Git activity events | 473.3 billion/month | Up 116.91% from the observation month above, not month over month |
| 2026-09 | Commits | 7.38 billion/month | Commit activity produced by people and agents together |
| 2026-09 | Actions runs | 3.26 billion/month | Workflow executions; these cannot be added to commits |
These figures show that code production and automated activity are changing in scale, even beginning to reshape the platform’s infrastructure. But a commit might represent a new feature, an agent’s checkpoint, an experiment or rework. 7.38 billion commits do not mean 7.38 billion useful results. Nor do the figures reveal how much Claude Code and Codex each contributed: the platform has not published a complete monthly breakdown of that kind.
The real industry impact is that starting a software experiment has become cheaper. Small scripts, migration tools and internal pages that once needed a place on the schedule can now be given to an agent for an initial implementation. As code supply expands, review, testing, merging and responsibility for production releases become more conspicuous bottlenecks. Evaluating a team solely on commit counts may reward whoever is best at generating activity.
How many more App Store apps? A genuinely monthly table
RevenueCat’s State of Subscription Apps 2026 publishes a series of new subscription app launches supplied by Appfigures. Below, we use only newly launched iOS subscription apps. This is neither all App Store apps, download volume nor the net increase in the store’s app inventory. The monthly values can be checked in the report’s public chart data. Its chart title and the endpoint on the horizontal axis differ, so we label the series by its actual data endpoint, January 2026.[4]
| Month | Newly launched iOS subscription apps | Month-over-month change |
|---|---|---|
| 2025-02 | 3,674 | — |
| 2025-03 | 4,742 | +29.07% |
| 2025-04 | 5,263 | +10.99% |
| 2025-05 | 5,189 | -1.41% |
| 2025-06 | 6,219 | +19.85% |
| 2025-07 | 6,683 | +7.46% |
| 2025-08 | 6,970 | +4.29% |
| 2025-09 | 7,498 | +7.58% |
| 2025-10 | 7,709 | +2.81% |
| 2025-11 | 7,515 | -2.52% |
| 2025-12 | 8,651 | +15.12% |
| 2026-01 | 11,448 | +32.33% |
Month-over-month change is the current month divided by the previous month, minus 1; we do not introduce an extra baseline outside the table for its first row. Between the two endpoints, monthly launches increased 211.59%, reaching approximately 3.12 times their starting level. That is the change between endpoints, not growth achieved every month. The declines in May and November 2025 also remind us that real trends are not lines that always go up.
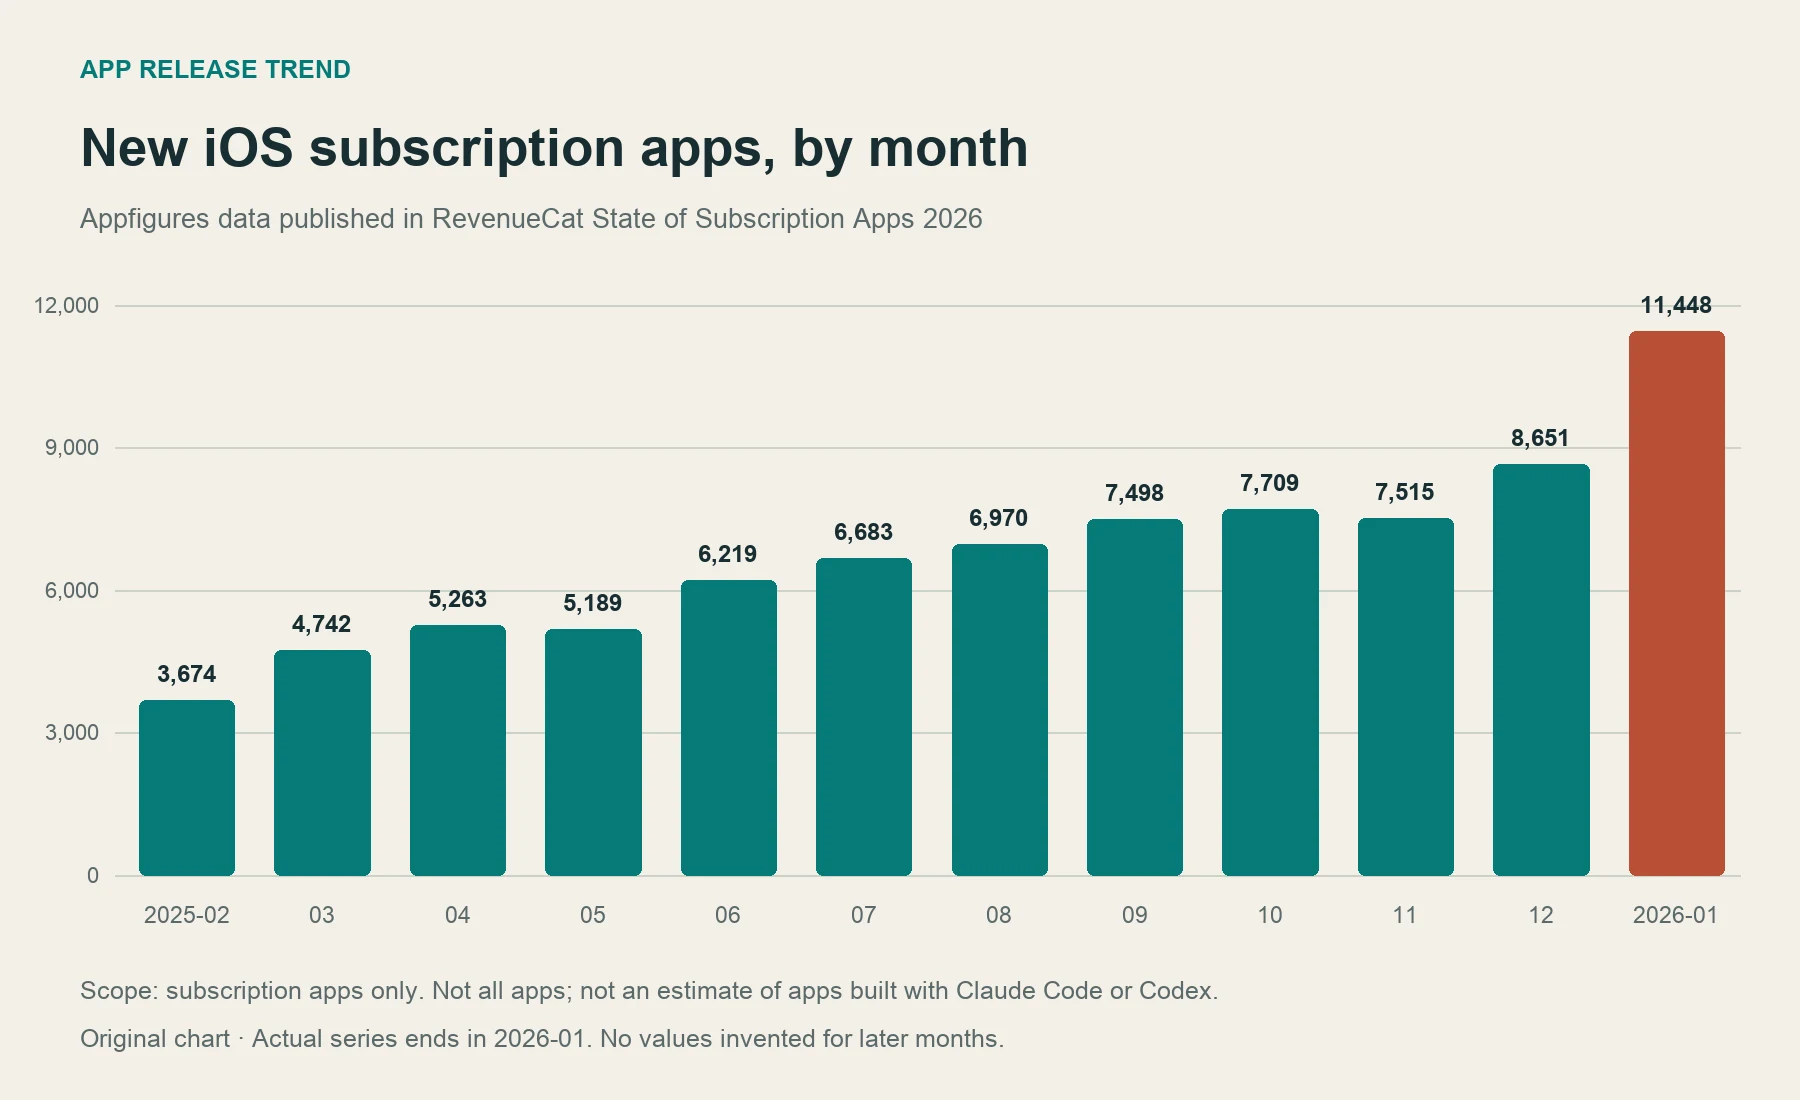
Figure: WISE AI chart redrawn from public monthly Appfigures/RevenueCat values. It covers only the subscription-app subset; missing subsequent months have not been interpolated.
There is also a signal in a broader measure: Appfigures reports that the number of newly released App Store apps in March 2026 was 118% higher than in March 2025. This compares the same month in two years, not consecutive months. The page does not publish the absolute counts for either observation month or identify the tools used to develop those apps.[5]
As of verification, we had not obtained a continuous February–September 2026 series using the same definition that could extend the table above. Subscription app counts, estimates for the US market and global new-app counts cannot be stitched into a single curve. We can confirm increasing supply, but cannot claim that all those new apps were made with Claude Code or Codex.
The easier it becomes to make an app, the more important it becomes to find a user willing to keep paying for it. For small teams, these tools lower the implementation barrier. They do not automatically establish whether demand is real, whether a product can be discovered or why users will stay. A surge in app numbers may also bring fiercer competition among similar products.
How much less work for programmers? Less typing and less time at work are different
There is currently no credible public monthly table showing how much these two tools have reduced programmers’ working hours across the software industry. What we can observe in particular samples is declining human intervention and improving task completion. Both matter, but neither can simply be renamed a “workload reduction rate.”
| Observation month | Sample and metric | Result | What cannot be inferred |
|---|---|---|---|
| 2025-08 → 2025-12 | Internal Anthropic Claude Code use: human interventions per session | 5.4 → 3.3, down approximately 38.9% | Programmers’ working hours fell 38.9% |
| 2026-05 | Internal sessions on complex, open-ended tasks judged by a Claude evaluator to finish without correction | 76% | The industry-wide production task success rate was 76% |
| 2026-09 | Within-month snapshot in the updated chart from that research | Approximately 91% | An independent audit confirmed that unattended production releases were safe |
The first row comes from Anthropic’s February 2026 study. The other two come from internal research updated through September 2026. Task composition and models can change; the September value is an approximation read from a chart, not an exact monthly average published as data.[6][7]
Measurement is also trying to catch up with the tools. In its February 2026 update on follow-up experiments, METR explicitly said that task-selection bias, parallel agents and time-recording problems made it difficult to quantify the actual benefits of the latest tools reliably. Old experiments cannot settle the verdict on new tools, and subjective impressions cannot establish that productivity has doubled across an industry.[8]
A piece of arithmetic is often overlooked: suppose output per unit of time doubles for a task of unchanged scope and quality. The time needed to complete that fixed task can then fall by 50%. But if the company also doubles the amount of work it wants done, total working hours need not fall. This is an illustration, not a survey finding. It explains why “higher efficiency” and “an easier working life” can diverge.
I place greater weight on a shift in roles that is already understandable: engineers move from performing every step themselves toward defining tasks, dividing up context, reviewing results, identifying risks and taking responsibility for releases. Prices for routine junior implementation work will face pressure, while the judgment of people who truly understand the business and its systems will be amplified by more machine execution. If managers turn every saved hour into another request, programmers may write less code without carrying less work.
How many layoffs at large software companies? Record the announcement month without crediting the tools
The table below selects events at software companies with verifiable sources. It records announcement months and announced job reductions, not the number of people who actually departed in those months or an industry total. The jobs include functions such as sales and operations; an unlisted month does not mean zero layoffs.
| Announcement month | Company | Announced reductions | Company explanation or key qualification |
|---|---|---|---|
| 2026-01 | Autodesk | Approximately 1,000 jobs | Primarily a sales transformation; the company denied that AI was replacing staff |
| 2026-03 | Atlassian | Approximately 1,600 jobs | Shifting skills and resources to reinvest in AI and enterprise sales |
| 2026-05 | Cloudflare | More than 1,100 jobs | Management explicitly linked restructuring to ways of working with agentic AI |
| 2026-05 | Intuit | Approximately 3,000 jobs | Multiple reasons, including reducing management layers, duplicated coordination and reallocating resources |
| 2026-07 | Microsoft | Approximately 4,800 jobs | Affected commercial and Xbox businesses; the company denied that these jobs were being replaced by AI |
The sources, in order, are public employee letters from Autodesk, Atlassian and Cloudflare, followed by Reuters reporting on Intuit and Microsoft.[9][10][11][12][13]
These events establish that software companies are reorganizing people, management layers and investment. Only some explicitly link the changes to AI. None of these materials provides an auditable breakdown of how many people Claude Code replaced and how many Codex replaced. Adding the figures together and labeling the total “caused by these two tools” would blend organizational change, various AI applications and specific coding agents into one story.
An earlier change may be hidden in hiring: whether a vacated position is filled, an outsourcing contract renewed, or a project that once needed more staff handled by the existing team plus agents. Layoff announcements are visible outcomes, but a reduction in demand for staff does not always appear as layoffs. This deserves closer monthly tracking next.
How much has token use grown at large companies? Evidence of surges, but no complete monthly ledger
A token is a unit used to measure text processed by a model. Agents repeatedly read context, reason, call tools and check results; as tasks multiply, use can rise quickly. Input, output and cached tokens have different prices, however, and models differ too. A total token count cannot be converted directly into cost, still less into productivity.
| Month or window | Verifiable metric | Value and evidence type |
|---|---|---|
| 2026-02 | Meta’s internal token consumption | Approximately 70 trillion tokens/month, estimated in a June 2026 SemiAnalysis report; not a publicly audited company bill, and no comparable month-over-month rate |
| Rolling 28-day windows ending 2025-11-01 and 2026-06-11 | Median output tokens per active employee in OpenAI’s legal function, combining ChatGPT and Codex | Approximately 13 times; company research, not total company usage |
| The same pair of rolling windows | The same metric for OpenAI’s research function | More than 50 times; not calendar months and not 50 times the output |
OpenAI’s study draws on internal logs, but its research setting has distinctive conditions around tool usage, training and adoption. SemiAnalysis’s Meta figure is external research reporting, without a clear split of input, output and cached tokens. The two cannot be plotted on the same growth curve.[14][15]
Public evidence remains insufficient to say how much large software companies’ total token use grows in each calendar month. Cloud platforms’ throughput across all customers, company revenue, employee seats and budget allowances cannot fill that gap. Nor do we quietly relabel a rolling 28-day window as June’s actual total.
The meaningful change is in budget composition: some implementation work previously priced in person-days is becoming spending on model calls, computation, verification and maintenance. The useful management question is “How much did each accepted task cost?” rather than “Who burned the most tokens?” Falling unit costs and rising total company usage can coexist, because tasks that were not previously worth doing now become feasible.
The next 12 months: how I expect software to change
The following covers November 2026 through October 2027. It is a baseline scenario to monitor month by month, not a prediction of events on precise monthly dates. Changes may arrive earlier, later or overlap. No unsupported industry layoff percentage is forecast.
| Observation month | Baseline scenario | How to test it |
|---|---|---|
| 2026-11 | More routine implementation and testing goes to Claude Code and Codex | Completion time and acceptance rate for tasks of equal scope |
| 2026-12 | Agent-generated changes keep increasing, and human review begins to queue | Monthly merged changes, review waiting time and rework rate |
| 2027-01 | Businesses begin tying agent budgets to project outcomes | Token cost and total cost per accepted task |
| 2027-02 | Hiring requirements for junior routine implementation roles keep changing | New job openings and the share of junior roles |
| 2027-03 | Simple outsourcing billed by person-day struggles to sustain a premium | Quotes for comparable projects, delivery time and quality commitments |
| 2027-04 | Small teams attempt product scopes that previously required more people | Features shipped per team, active users and incidents |
| 2027-05 | App supply keeps competing for limited attention | Track new releases, retention and paid conversion separately |
| 2027-06 | Legacy-system modernization becomes an important agent use case | Completed migrations, regression defects and rollbacks |
| 2027-07 | Security, permissions and dependency governance become more important | Vulnerability remediation time, unauthorized actions and remediation costs |
| 2027-08 | Requirements judgment and business ownership remain harder to replace than implementation alone | Product experiment success, customer renewals and revenue quality |
| 2027-09 | Companies reconsider building software versus buying standard products | Full lifecycle costs and maintenance burden of in-house software |
| 2027-10 | Teams gain more advantage from sustainable delivery than headcount | Reliable output per person, profit and production stability together |
My baseline view is that the same number of people will deliver more software, some hiring needs will be absorbed, and more spending will go to models, review and security. If reliability keeps improving while new demand fails to keep pace, routine implementation roles will face stronger substitution pressure. If security incidents, review burdens and compute costs rise, adoption may slow.
The work most likely to face price pressure first is repetitive implementation with clear boundaries and straightforward acceptance criteria. Harder to commoditize is knowing what is worth building, what must not ship and how to recover a system when things go wrong. Claude Code and Codex will expand how much one person can execute, but business responsibility will not disappear.
Finally, a strong condemnation of Anthropic’s exclusionary restrictions on mainland Chinese developers
Criticism must begin with accurate facts. In September 2025, Anthropic expanded sales restrictions for unsupported regions to cover companies with particular ownership and control relationships. Its current Supported Regions Policy, checked in October 2026, explicitly covers Claude Code and addresses physical location, corporate incorporation or headquarters, and direct or indirect majority ownership or control. Mainland China is not on the supported list. This does not mean that every Chinese national or every person of Chinese ethnicity is categorically barred everywhere in the world.[16][18]
The October 8, 2026 announcement also introduced a new Usage Policy effective November 12, 2026, while saying that the regional section clarifies enforcement. The future effective date must not be confused with existing regional restrictions.[17]
We strongly condemn Anthropic’s policy of shutting ordinary developers in mainland China, and companies meeting its restriction criteria, out of Claude Code. We strongly condemn an approach that excludes so many legitimate users along with everyone else it targets. As coding agents begin to influence the barriers to starting a business, production costs and career opportunities, these restrictions hurt real people: students who want to learn, engineers who make their living delivering software, and small teams building serious products.
A company may prevent specific abuses and should meet applicable legal obligations. But those reasons do not automatically exempt broad exclusion from public scrutiny. Anthropic should publicly explain the grounds and boundaries of its restrictions, provide transparent appeals and restore equal access for legitimate civilian development wherever possible. The more power a tool has to change an industry, the less it should disregard the people left outside.
The same standard applies to OpenAI: its official API support list also excludes mainland China, so Codex must not be portrayed as an officially supported alternative route there.[19] Appreciation for excellent tools does not prevent criticism of their companies’ access policies. Technical capabilities deserve recognition; policies that exclude ordinary developers deserve strong opposition.
This article belongs to the AI Applications special report. Platform statistics describe the background, provider logs offer observations from samples, and future judgments and policy positions are identified separately.